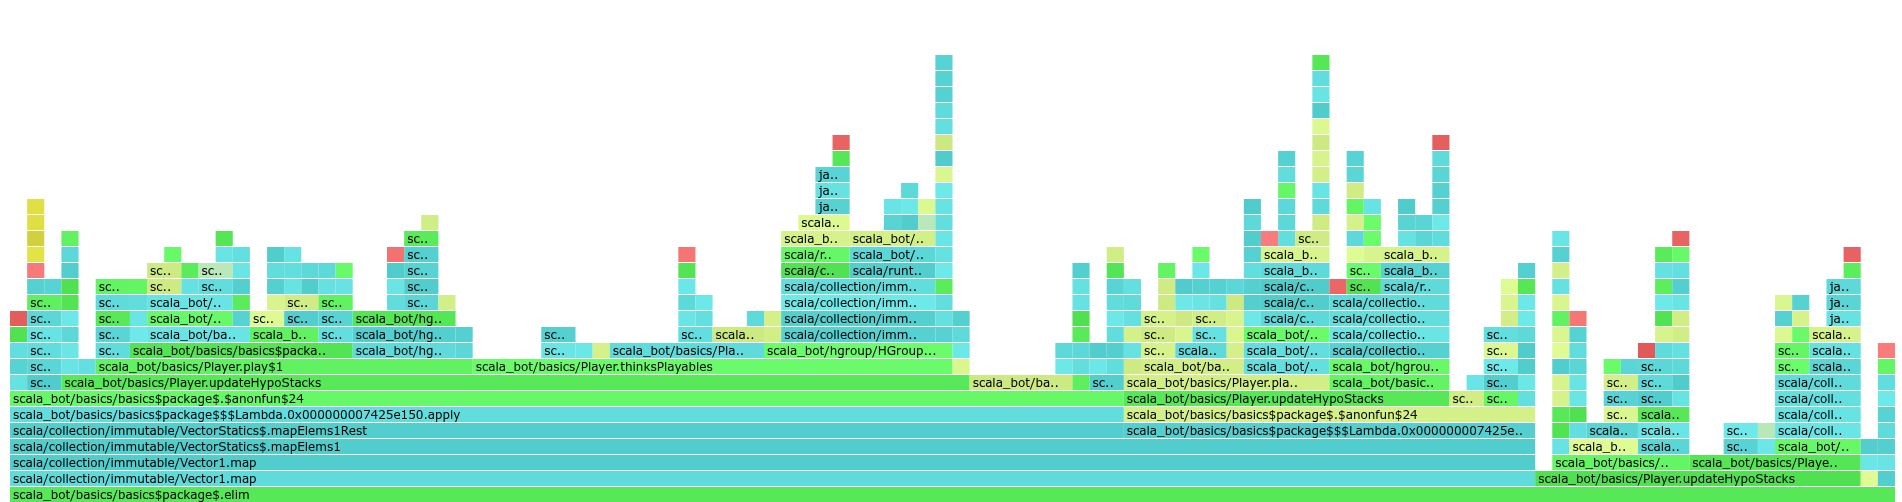
A flamegraph is one of the few tools I still use from my Programming for Performance course in university, and it's been an invaluable one for improving the performance of my programs. Here's a sample of the flamegraph of my Hanabi bot:
About flamegraphs
Essentially, a flamegraph is a visual representation of where your program spends its CPU time. The base takes up the entire screen width and represents 100% of the time. Individual rectangles are stacked on top where each rectangle represents a new stack frame (i.e. a function call) and its width corresponds to the ratio of time spent inside it.
Nested functions make the graph taller, and functions that take more time are wider1. Based on the distribution of time, some functions may not even appear in the flamegraph. As far as I know, the data for the flamegraph is simply generated by sampling where the program counter is every X ns, and aggregating this data into a graph. This also allows multiple calls to the same function at the same level to be "merged" into one, to reduce visual noise.
Using the flamegraph
You can identify good areas for optimization by looking for functions that dominate the width of the flamegraph. At the same time, if a function shows up as very thin, there isn't much to be gained by optimizing it. This is much better than the naive approach of optimizing whatever is most obvious, since without data you may end up optimizing some function which is called extremely rarely. Typically, you want to look for wide rectangles near the top of individual "flames" that either don't have children or whose children don't take up much of the width.2
However, the flamegraph doesn't indicate the exact cause; you need to look at the source code of the slow functions and determine where the time is being spent. Often this can be due to nested loops, long computations or an I/O-bound task. Once identified, traditional optimization methods like reducing unnecessary work, pre-computation, caching, laziness, etc. can be applied until the shape of the flamegraph changes.
Most flamegraph viewers contain a search function which highlights all rectangles whose label match a given regex. They also conventioniently show a % of the current total width taken up by the highlighted rectangles. This can reveal extremely common functions that are called ubiquitously and are thus prime targets for optimization. (For example, the elim() function in my Hanabi bot that handles empathy takes up a whopping 75% of the flamegraph width, since it's called everywhere. It's incredibly important for this function to be as fast as possible!)
Creating a flamegraph
I've generated flamegraphs for programs written in Rust, JavaScript and Scala without too much trouble. Just search for a flamegraph library (installing various profiler tools when necessary) and have some representative program you want to profile. When generating a flamegraph, it's better to have a program that runs for a long time than one that terminates quickly. The profiler can always be cut off early, but if the runtime is too short then the sampling rate may be too slow to identify many relevant functions.
Every generator I've used created an HTML file that I can open in the browser and interact with, which has been super helpful. For example, I can click on an individual rectangle to zoom in so that its width becomes 100% of the screen width.
An example?
I was going to include an example here, but I ended up procrastinating on that for weeks, so I'll just post this now and possibly add an example eventually.
-
It's called a "flamegraph" because the thinning rectangles appear to form the shape of a flame. Most flamegraph viewers also colour the rectangles orange and red to resemble flames, but the colour has no additional meaning otherwise. ↩
-
If your language compiles to bytecode like Java/Scala, the uppermost function(s) in a flame may be some low-level bytecode and thus not part of the source code. Going down a level or two should reveal which function in the source code is being compiled to those calls, though. ↩